Poll Brief - September 3
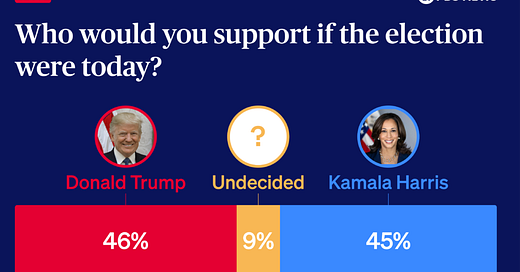
What are the polls looking like 62 days out from the election? Numbers indicate the percentage of the voters who chose that option.
National Polls (Updated and includes polls from August 29 -September 1)
ABC News/Ipsos National Poll (September 1)
National, Trump vs Harris (just picking between Trump and Harris): Harris 50, Trump 46, Harris + 4
National, Multi-Candidate (includes third party including Stein, West, and Oliver, as well as Trump and Harris): Harris 50, Trump 45, Stein 1, West 2, Oliver 1, Harris + 5
Wall Street Journal (August 29)
National, Trump vs Harris: Harris 48, Trump 47, Harris +1
Rasmussen Reports (August 29)
National, Trump vs Harris: Harris 46, Trump 48, Trump +2
Reuters/Ipsos (August 29)
National, Trump vs Harris: Harris 45, Trump 41, Harris +4
National, Multi-Candidate (includes Kennedy, Stein, West, and Oliver, Trump, and Harris): Harris 44, Trump 40, Kennedy 6, Stein 1, West 1, Oliver 1, Harris + 4
State Polls (Updated and includes polls from August 29 -September 1)
Gonzales Research (September 3)
Maryland: Trump vs Harris: Harris 56, Trump 35, Harris + 21
Trafalgar Group (August 31)
Pennsylvania: Trump vs Harris: Harris 45, Trump 47, Trump +2
Michigan: Trump vs Harris: Harris 47, Trump 47, Tie
Wisconsin: Trump vs Harris: Harris 46, Trump 47, Trump +1
Insider Advantage (August 31)
Arizona: Trump vs Harris: Harris 48, Trump 49, Trump +1
Nevada: Trump vs Harris: Harris 47, Trump 48, Trump +2
North Carolina: Trump vs Harris: Harris 48, Trump 49, Trump +1
Georgia: Trump vs Harris: Harris 48, Trump 48, Tie
The Hill/Emerson (August 29)
Arizona: Trump vs Harris: Harris 47, Trump 50, Trump +3
Georgia: Trump vs Harris: Harris 49, Trump 48, Harris +1
Michigan: Trump vs Harris: Harris 50, Trump 47, Harris +3
Nevada: Trump vs Harris: Harris 49, Trump 48, Harris +1
Pennsylvania: Trump vs Harris: Harris 48, Trump 48, Tie
Wisconsin: Trump vs Harris: Harris 48, Trump 49, Trump +1
National 2024 General Election Average: Harris +1.9
National 2024 Generic Congressional Average: Democrats +1.1
Average Polling About Direction of the Country: Wrong Track +36.5
A Note About Margin of Error:
A general rule of thumb when reading election polling is that the margin of error is around 3 percentage points. That means that some mistake or miscalculation in the polling practice could result in a skewed answer that is 3 above or below the stated percentage. Because of this, it is not ideal to rely on polling that says a candidate is up by anything under around 5 percentage points. This means that much of the polling data given above is well within the margin of error, meaning this data is not concrete about who will win the election. This data is meant to update readers on the general feel that pollsters are getting about this election, so please read it as such.
Polling data sources from Real Clear Polling.


